Updated Jul 2026
Find Your Next Great Lake Adventure
We grade the water, not the view — A–F report cards on clarity, algae, and fish for 10,112 lakes across 36 states.
LakeQuality grades every monitored lake across 36 states — water clarity in feet, swimming safety, and A-F report cards based on EPA and state agency data — plus lake depth and fish species where state DNR data is available.
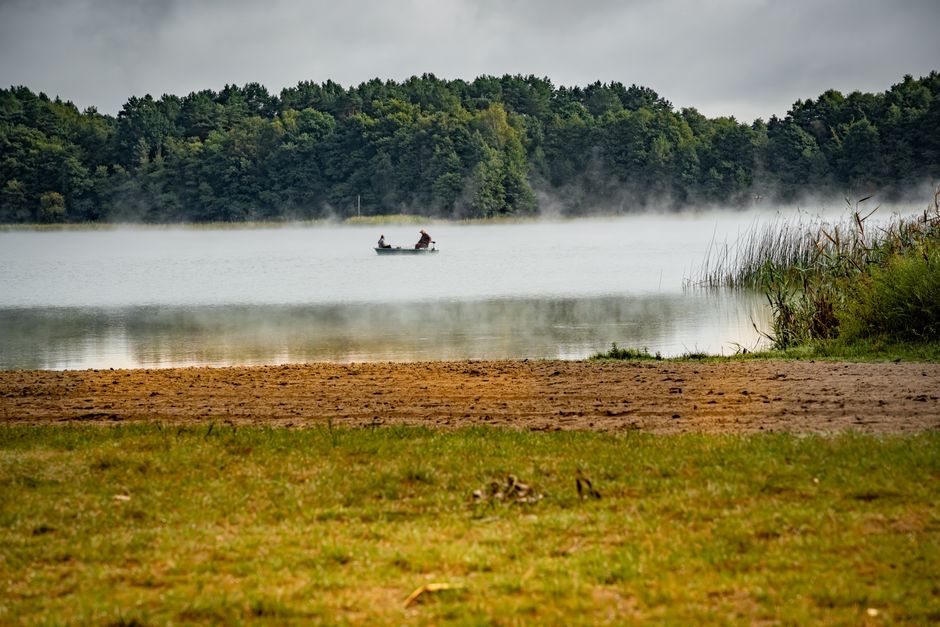
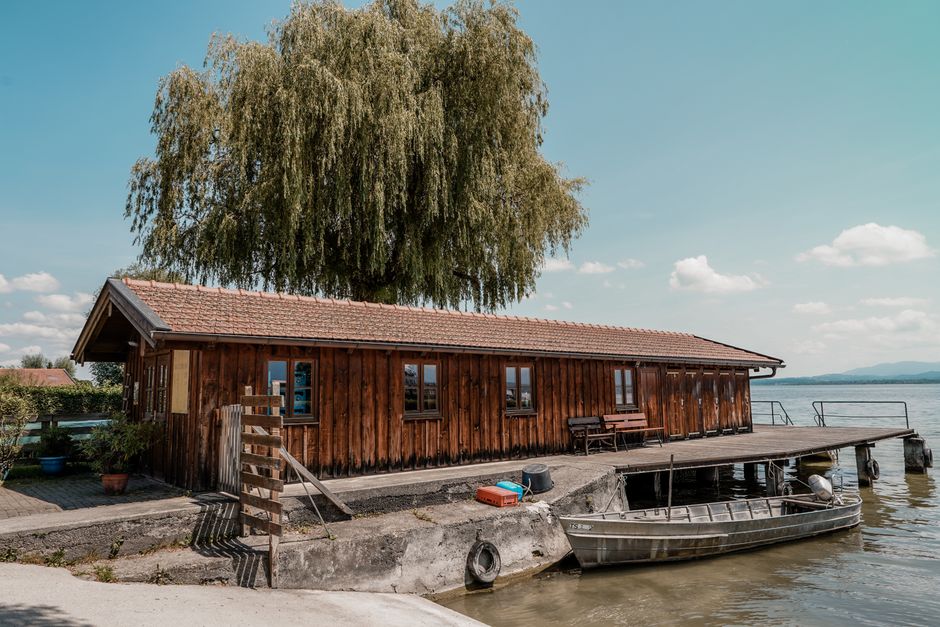
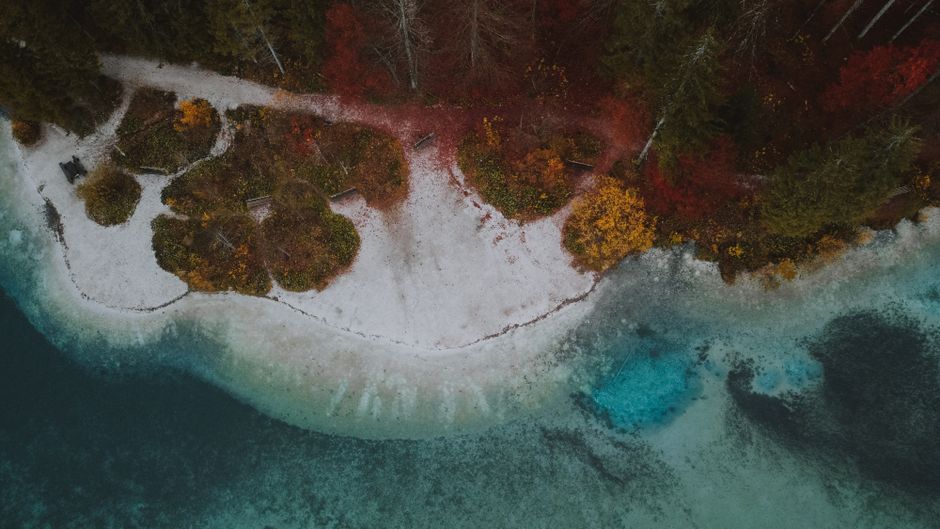
See every grade at a glance on the interactive lake map, or go deep on our most detailed region — the Boundary Waters canoe country of northern Minnesota.
New · Data Report
The State of America’s Lakes 2026
Our annual report ranks the cleanest and most-polluted lakes, worst algae hotspots, and biggest improvers across 9,629 monitored lakes in 36 states — 45.5% grade A or B, 31.1% grade D or F.
National grade distribution
Fish Species
3,391 lakes with documented fish species. Find the best lakes for your target species.
Species outlook, spawn timing, and the best depths & techniques for any lake — from its measured water quality, not just the moon.
Top walleye lakes by water quality
Largemouth & smallmouth bass
Top muskellunge lakes
Coldwater lake rankings
Water Quality Rankings
Explore lakes by water quality, depth, clarity, and more — or compare any two lakes side by side.
Latest DNR Fisheries Reports
Newest scientific surveys and resources from Minnesota and Wisconsin DNR. 5,243 reports indexed across 128 counties. Open any survey on its lake or county page — browse all →
Best Lakes For...
Data-driven picks for every activity, filtered by water quality, access, fish, depth, and size — then plan a lake trip and find where to stay.
Latest Articles
Data-driven reporting on lake water quality, algae, fishing, and swimming safety — browse all articles →
A water-quality due-diligence checklist for lakefront buyers: clarity trend, nutrient impairment, algae history, invasive species, and depth.
A five-check framework for picking a lake with good water quality: clarity, phosphorus, algae history, depth, and trend.

The best-graded lakes for swimming this summer, ranked by clarity and low algae, plus what to check the day you go.
Where harmful-algae risk concentrates this summer, by nutrient impairment and elevated algae signals across the 12 states we track.
The top-graded lakes in each of the 12 states we cover, ranked by water clarity, phosphorus, and algae.
A data snapshot of 6,000+ monitored lakes across 12 states: grade distribution, the clearest and greenest states, and what's improving.
Invasive Species Tracker
Zebra mussels, Eurasian watermilfoil, and other invasive species — 1,777 lakes with documented infestations across 36 states. Check before launching your boat.
Ice-Out Dates
When does your lake thaw? Historical ice-out data for 1,000+ Minnesota lakes. Earliest, latest, and longest open water season.
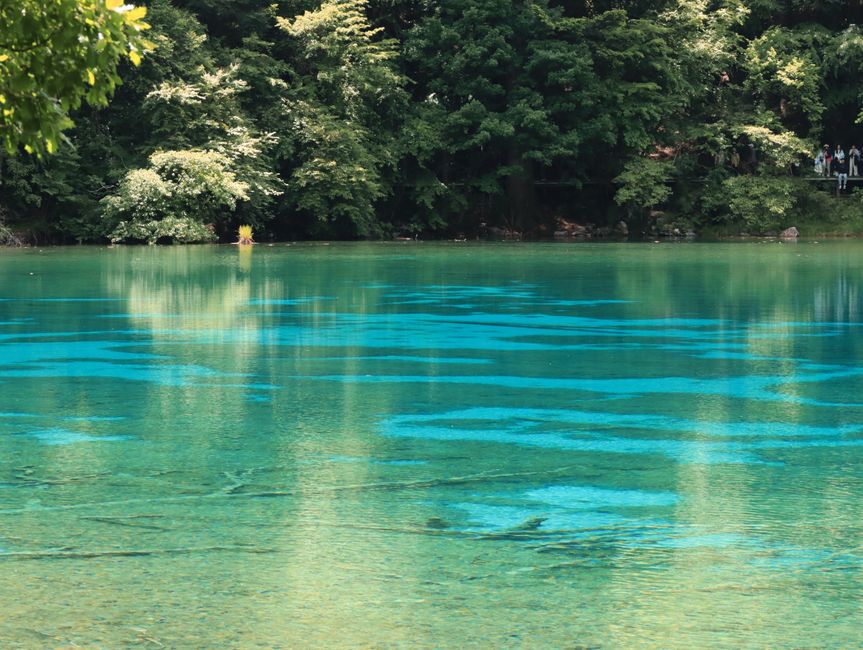
Cleanest Lakes
East Fox Lake
Crow Wing County, Minnesota
See grade for East Fox Lake →North Long Lake
Crow Wing County, Minnesota
See grade for North Long Lake →Bad Medicine Lake
Becker County, Minnesota
See grade for Bad Medicine Lake →Big Sugar Bush Lake
Becker County, Minnesota
See grade for Big Sugar Bush Lake →Round Lake
Cook County, Minnesota
See grade for Round Lake →Round Lake
Beltrami County, Minnesota
See grade for Round Lake →Horseshoe Lake
Cass County, Minnesota
See grade for Horseshoe Lake →Long Lake
Cass County, Minnesota
See grade for Long Lake →Long Lake
Clearwater County, Minnesota
See grade for Long Lake →Long Lake
Beltrami County, Minnesota
See grade for Long Lake →Long Lake
Becker County, Minnesota
See grade for Long Lake →Long Lake
Itasca County, Minnesota
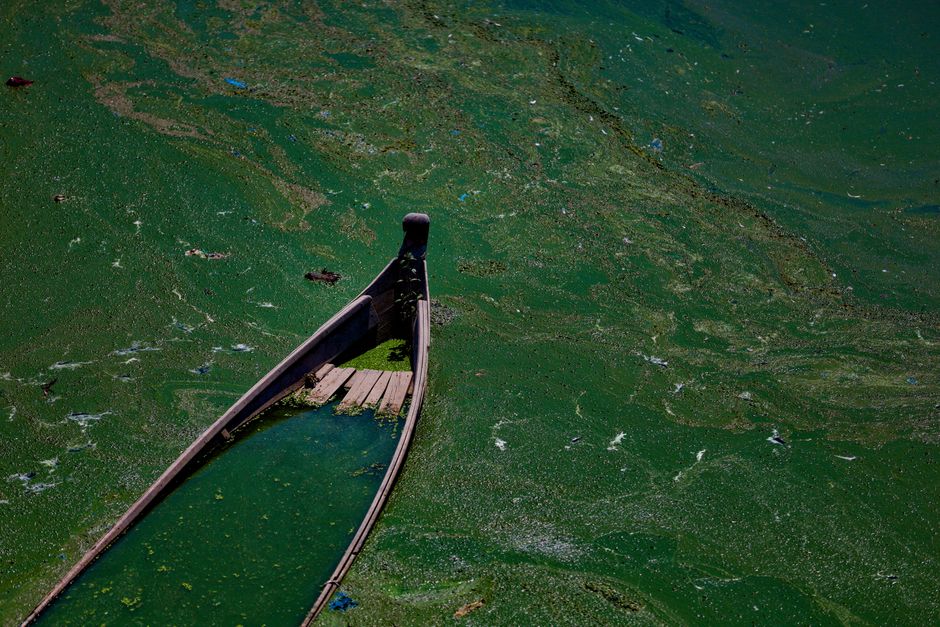
See grade for Long Lake →Lakes Needing Attention
Kabetogama Lake
St. Louis County, Minnesota
See grade for Kabetogama Lake →North Long Lake
Ramsey County, Minnesota
See grade for North Long Lake →Snelling Lake
Hennepin County, Minnesota
See grade for Snelling Lake →Horseshoe Lake
Rice County, Minnesota
See grade for Horseshoe Lake →Long Lake
Stearns County, Minnesota
See grade for Long Lake →Long Lake
Cottonwood County, Minnesota
See grade for Long Lake →Long Lake
Hennepin County, Minnesota
See grade for Long Lake →Long Lake
Dakota County, Minnesota
See grade for Long Lake →Jonathan Lake
Carver County, Minnesota
See grade for Jonathan Lake →Peltier Lake
Anoka County, Minnesota
See grade for Peltier Lake →Clear Lake
Meeker County, Minnesota
See grade for Clear Lake →Clear Lake
Brown County, Minnesota
See grade for Clear Lake →Browse by State
Minnesota
2,403 lakes graded across 75 counties
Wisconsin
1,422 lakes graded across 69 counties
Illinois
144 lakes graded across 45 counties
Michigan
628 lakes graded across 61 counties
Iowa
170 lakes graded across 75 counties
Ohio
17 lakes graded across 9 counties
Pennsylvania
3 lakes graded across 3 counties
New York
189 lakes graded across 47 counties
Missouri
285 lakes graded across 78 counties
Indiana
22 lakes graded across 7 counties
North Dakota
150 lakes graded across 48 counties
South Dakota
4 lakes graded across 3 counties
Florida
2,194 lakes graded across 59 counties
Colorado
89 lakes graded across 44 counties
North Carolina
151 lakes graded across 57 counties
Vermont
227 lakes graded across 14 counties
Texas
146 lakes graded across 84 counties
Oregon
73 lakes graded across 22 counties
Arkansas
136 lakes graded across 52 counties
Oklahoma
34 lakes graded across 17 counties
Kansas
194 lakes graded across 75 counties
Nebraska
71 lakes graded across 47 counties
Nevada
55 lakes graded across 12 counties
Arizona
61 lakes graded across 14 counties
Idaho
47 lakes graded across 16 counties
Montana
187 lakes graded across 14 counties
New Mexico
59 lakes graded across 20 counties
Tennessee
67 lakes graded across 39 counties
Alabama
88 lakes graded across 44 counties
Virginia
114 lakes graded across 50 counties
Kentucky
107 lakes graded across 73 counties
Utah
169 lakes graded across 28 counties
Washington
42 lakes graded across 15 counties
Wyoming
216 lakes graded across 19 counties
Georgia
50 lakes graded across 31 counties
Massachusetts
98 lakes graded across 12 counties
Grade Distribution
Featured Lakes
Lake St. Croix
Washington County, Minnesota
See grade for Lake St. Croix →Kabetogama Lake
St. Louis County, Minnesota
See grade for Kabetogama Lake →
Rainy Lake
Koochiching County, Minnesota
See grade for Rainy Lake →Little Shoepack Lake
St. Louis County, Minnesota
See grade for Little Shoepack Lake →Namakan Lake
St. Louis County, Minnesota
See grade for Namakan Lake →Kabetogama Lake
St. Louis County, Minnesota
See grade for Kabetogama Lake →Rainy Lake
St. Louis County, Minnesota
See grade for Rainy Lake →Rainy Lake
St. Louis County, Minnesota
See grade for Rainy Lake →Sand Point Lake
St. Louis County, Minnesota
See grade for Sand Point Lake →Oslo Lake
St. Louis County, Minnesota
See grade for Oslo Lake →Kabetogama Lake
St. Louis County, Minnesota
See grade for Kabetogama Lake →Namakan Lake
St. Louis County, Minnesota
See grade for Namakan Lake →Jorgens Lake
St. Louis County, Minnesota
See grade for Jorgens Lake →Kabetogama Lake
St. Louis County, Minnesota
See grade for Kabetogama Lake →Rainy Lake
St. Louis County, Minnesota
See grade for Rainy Lake →Frequently Asked Questions
How are lake grades calculated?
Grades are based on three water quality metrics: water clarity (Secchi depth), phosphorus levels, and chlorophyll-a concentration. Each metric is graded A-F using Metropolitan Council standards established in the 1980s. The overall grade is the average of available metrics.
Where does the data come from?
Water quality data comes from the EPA Water Quality Portal, which aggregates monitoring results from state environmental agencies in all 36 covered states (including the Minnesota Pollution Control Agency and Wisconsin DNR), the USGS, and other federal programs. Lake depth comes from the Minnesota DNR LakeFinder and Wisconsin DNR; fish species data covers Minnesota, Wisconsin, and Michigan.
How often is the data updated?
Data is sourced from the EPA Water Quality Portal covering the most recent 5 years of monitoring. Lake grades reflect the median summer season (June-September) measurements.
What does each metric mean?
Secchi depth measures water clarity in feet (how deep you can see). Phosphorus fuels algae growth, higher levels mean more algae risk. Chlorophyll-a directly measures algae concentration in the water.
Is it safe to swim in a lake graded C or below?
Lakes graded C have moderate water quality and are generally safe for swimming, though algae may be present. Lakes graded D or F have poor water quality with high algae risk, swimming is not recommended. Always check local health department advisories.
What is the Trophic State Index?
The Carlson Trophic State Index (TSI) classifies lakes by nutrient levels: oligotrophic (TSI < 40, clear and clean), mesotrophic (40-50, moderate nutrients), eutrophic (50-70, high nutrients and algae), and hypereutrophic (> 70, excessive algae). It is calculated from Secchi depth, phosphorus, and chlorophyll-a.
Get lake water-quality grades by email
New grades, clarity readings, and algae advisories as the data updates. No spam, unsubscribe anytime.